
The central camera photographs the same plant position repeatedly and stores every image with its plant, cultivation cycle and camera settings.

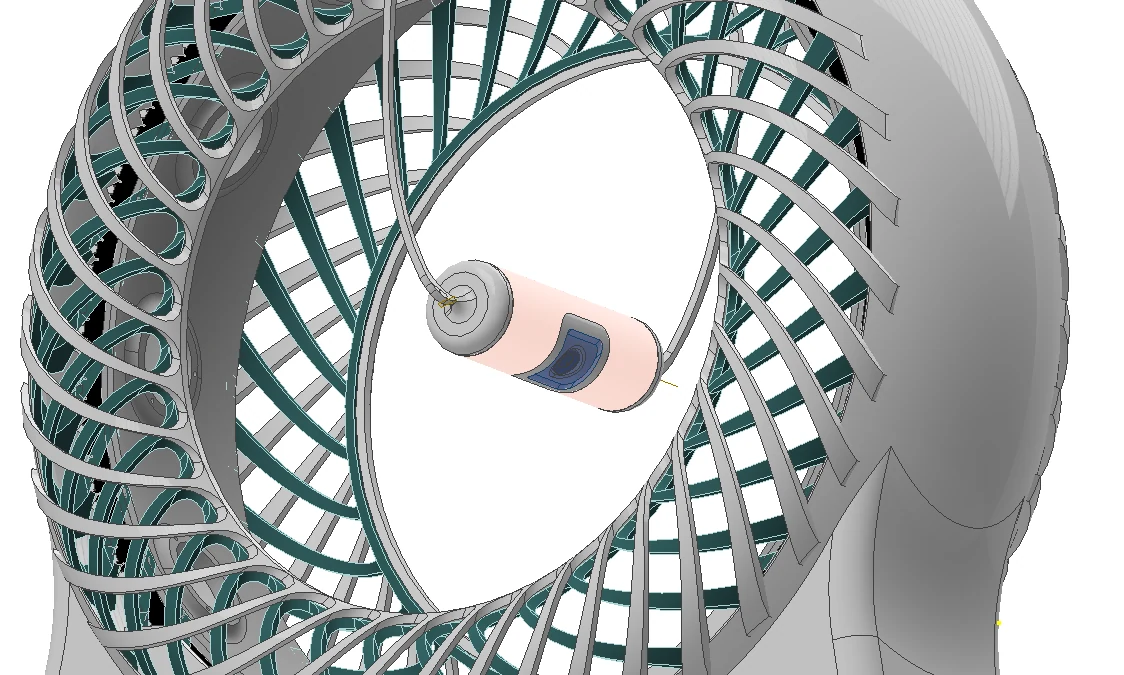
Camera geometry
The camera is fixed to the central module. The rotor stops at a known encoder position and presents one plant module to the lens. At that position, the optical axis meets the local plant plane at 90°. The distance, lens and framing therefore remain comparable when the same plant returns for its next image. The acquisition record stores camera version, lens, focus, working distance, encoder position and image dimensions.
Indexed camera geometry
The camera faces the plant module at 90° when the rotor reaches its recorded capture position.
Values
| Series | Value | Note |
|---|---|---|
| Fixed camera | Lens, focus and pose are recorded | The camera remains fixed to the stationary central module. Its lens, focus, working distance and orientation belong to the acquisition record. |
| Optical axis | 90° to the plant plane | At the indexed position, the perpendicular view limits perspective change between observations of the same plant. |
| Indexed rotor position | Position ID and encoder state | A capture is accepted only when the plant module reaches its defined angular position and motion is below the blur threshold. |
| Optical references | Scale, colour and light state | A scale reference and periodic colour target detect changes in camera geometry, illumination and colour rendering. |
Note. FlavoRotor camera geometry is documented in I02. Repeatable phenotyping practice follows Arend et al. (2016).
What is stored with each image
The image file alone is not enough. Its record identifies the plant, growth cycle, rotor position, exposure, gain, white balance and light state. A scale reference makes pixel measurements comparable. A colour target reveals changes in illumination or camera response. Focus, clipping and occlusion are stored as visible image-quality fields.
| Field group | Stored values | Reason |
|---|---|---|
| Plant | plant_id, crop, cultivar, seed lot, cycle_id | keeps repeated images attached to one biological specimen |
| Position | position_id, encoder index, camera pose, working distance | shows where and how the image was taken |
| Camera | camera_version, lens, focus, exposure, gain, white balance | separates plant change from camera change |
| Growing conditions | recipe_version, light state, temperature, pH, EC, rotation state | connects the image to the measured environment |
| File history | timestamp_utc, SHA-256, annotation version, operator | identifies the exact file and label version |
Images used for model development
Three image sources have different jobs. ImageNet supplies the general visual weights used to initialise MobileNetV2. PlantVillage supplies clean, labelled leaf images. PlantDoc adds leaves photographed with natural backgrounds and changing viewpoints. FlavoRotor images represent the camera, lighting and plant geometry in which the model operates. Results from these sources remain separate because a clean single-leaf photograph is different from a plant growing inside the machine.
| Images | Content | Use |
|---|---|---|
| ImageNet-1K | general photographs from many object classes | initial weights for edges, textures and shapes |
| PlantVillage | 54,306 controlled RGB leaf images covering healthy tissue and plant diseases | controlled leaf-classification benchmark |
| PlantDoc | 2,598 plant images from 13 species and 27 healthy or disease classes | comparison under natural backgrounds and variable framing |
| FlavoRotor | indexed images from the central camera | device-specific plant tracking and evaluation |
The reproducible web example downloads the complete PlantVillage Strawberry RGB subset at repository commit 7f7ecc7: 456 healthy images and 1,109 leaf-scorch images. The repository's published leaf map identifies 1,232 of those images as observations of 190 physical leaves. The Python script records every selected filename, SHA-256 hash, class, leaf group and transform parameter.
PlantVillage strawberry images used in the reproducible example
These are unaltered RGB files from separate published leaf groups. Select an image to inspect its source filename and leaf identifier.
Values
| Series | Value | Note |
|---|---|---|
| Healthy · leaf 49 | Published RGB image · 256 × 256 px | 64aea8c6-24df-40c1-9d68-0221f4151383___RS_HL 2103.JPG · SHA-256 c83901b7…2b5d. |
| Healthy · leaf 57 | Published RGB image · 256 × 256 px | d50fa8fa-015b-41f6-a2aa-18efcf041f6e___RS_HL 2188.JPG · SHA-256 1a40422c…69c4. |
| Healthy · leaf 75 | Published RGB image · 256 × 256 px | 78debbd4-43b4-437d-8fd8-86910b947d34___RS_HL 4459.JPG · SHA-256 3904614b…ac6f. |
| Healthy · leaf 61 | Published RGB image · 256 × 256 px | 411e3372-e40e-44ed-aa47-972afabd15f7___RS_HL 2225.JPG · SHA-256 07c17d2f…24f. |
| Leaf scorch · leaf 69 | Published RGB image · 256 × 256 px | 212433a4-4bda-450e-8026-02ffa42f9f32___RS_L.Scorch 1551.JPG · SHA-256 7c4e91ed…ce81. |
| Leaf scorch · leaf 16 | Published RGB image · 256 × 256 px | 16311953-0608-43c1-829d-d78b990a0fa4___RS_L.Scorch 0995.JPG · SHA-256 5d5f1729…7c55. |
| Leaf scorch · leaf 74 | Published RGB image · 256 × 256 px | f8c43823-8efa-4f97-8e37-8ab7e0115fd0___RS_L.Scorch 1604.JPG · SHA-256 18ac7e23…8e6f. |
| Leaf scorch · leaf 60 | Published RGB image · 256 × 256 px | d0d0377c-6c41-4bb4-abd8-f21553d37c09___RS_L.Scorch 1459.JPG · SHA-256 041c90ad…26a. |
Note. Images from the PlantVillage Strawberry RGB subset (Mohanty, Hughes, & Salathé, 2016), repository commit 7f7ecc7, CC BY-SA 3.0. Displayed at a common size without synthetic symptoms.
Split by physical leaf
Photographs of the same physical leaf stay together. The deterministic seed 20260729 assigns leaf groups to 70% training, 15% validation and 15% test partitions. This prevents near-duplicate photographs of one leaf from appearing in both training and test data.
| Class | Training | Validation | Test |
|---|---|---|---|
| Healthy | 316 images / 80 leaves | 68 images / 17 leaves | 72 images / 18 leaves |
| Leaf scorch | 534 images / 52 leaves | 115 images / 11 leaves | 127 images / 12 leaves |
| Total | 850 images / 132 leaves | 183 images / 28 leaves | 199 images / 30 leaves |
Image augmentation
The Python preprocessing script creates the examples below from one published leaf-scorch image. Rotation, scale, brightness, contrast, saturation, blur and sensor noise change the complete frame by a recorded amount. They do not paint new spots or remove existing tissue. Only the training partition receives random augmentation; validation and test images keep their original pixels apart from the fixed resize and normalisation.
Deterministic augmentation examples
The Python script applies small, recorded changes to one published image. It does not draw, remove or recolour a symptom.
Values
| Series | Value | Note |
|---|---|---|
| Original | No transform | Published PlantVillage RGB source image. The repository JPEG remains unchanged. |
| Geometry | Rotation +6° · scale 0.96 · translation 2.5% / 2% | A deterministic affine transform reproduces a small indexing and framing difference. |
| Brightness and colour | Brightness 1.07 · contrast 1.10 · saturation 0.96 | The transform changes the complete frame uniformly; it does not add a local lesion. |
| Blur and sensor noise | Gaussian blur 0.7 px · noise σ = 2/255 | The deterministic example represents a small optical and sensor difference. |
Note. Source image: PlantVillage Strawberry leaf scorch, leaf group 69, commit 7f7ecc7, CC BY-SA 3.0. Parameters and SHA-256 hashes are stored in manifest.json. Transform structure follows Buslaev et al. (2020).
MobileNetV2 and the MLP classifier
The reference model receives a 224 × 224 sRGB image. MobileNetV2, initialised with ImageNet-1K weights, converts the image into a 7 × 7 × 1,280 feature map. Global average pooling produces a 1,280-value vector. The MLP maps that vector to 256 ReLU6 units, applies dropout 0.25, and produces one logit for every declared plant-health class.
| Stage | Shape | Operation |
|---|---|---|
| Input | 224 × 224 × 3 | sRGB image with ImageNet normalisation |
| Encoder | 7 × 7 × 1,280 | MobileNetV2 features |
| Pooling | 1,280 | global average pooling |
| Hidden layer | 256 | linear layer, ReLU6 and dropout 0.25 |
| Output | C | one logit per class |
| Probability | C | softmax followed by validation-set temperature scaling |
Why this model fits the camera task
MobileNetV2 uses depthwise convolutions and inverted residual blocks. With the 256-unit classifier, it contains 2,586,434 parameters. The same camera is evaluated at every indexed plant position, so model size and single-image latency matter alongside classification performance.
The classifier head
Global average pooling converts the 7 × 7 × 1,280 encoder output into one 1,280-value feature vector. The multilayer perceptron learns combinations of those features that separate the declared classes. ReLU6 bounds each hidden activation between 0 and 6; dropout removes 25% of hidden activations at random during fitting. The final linear layer returns two logits, which softmax converts into class probabilities.
ExplanationThe frozen image encoder produces a feature vector. A 256-unit hidden layer transforms it, dropout regularises training and the output layer produces one score for each class.
The 1,280 × 256 hidden layer has 327,680 weights and 256 biases. The 256 × 2 output has 512 weights and 2 biases. The MLP therefore contributes 328,450 trainable parameters.
Encoder comparison
MobileNetV2, EfficientNetB0 and ResNet50 were tested with the same frozen ImageNet protocol, 256-unit ReLU6 MLP, physical-leaf split and three deterministic seeds. All three reached 100% mean accuracy on the 199-image controlled test. The natural-background PlantDoc check separated them: mean healthy-class recall was 84.38% for MobileNetV2, 74.65% for EfficientNetB0 and 55.90% for ResNet50.
Image encoder comparison
Same frozen ImageNet encoder protocol, grouped data split, MLP head and three seeds.
Values
| Series | Value | Note |
|---|---|---|
| MobileNetV2 | PlantDoc healthy recall 84.38% · median CPU latency 60.59 ms | 2,586,434 parameters; 10.35 MB FP32 parameter memory; controlled grouped-test accuracy 100.00%; external recall range 81.25–88.54% across three deterministic seeds. |
| EfficientNetB0 | PlantDoc healthy recall 74.65% · median CPU latency 83.35 ms | 4,378,021 parameters; 17.51 MB FP32 parameter memory; controlled grouped-test accuracy 100.00%; external recall range 67.71–81.25% across three deterministic seeds. |
| ResNet50 | PlantDoc healthy recall 55.90% · median CPU latency 171.27 ms | 24,112,770 parameters; 96.45 MB FP32 parameter memory; controlled grouped-test accuracy 100.00%; external recall range 40.63–71.88% across three deterministic seeds. |
PlantVillage controlled test and PlantDoc natural-background transfer check; TensorFlow 2.18 CPU inference on an Intel Xeon E5-2699 v3 with a three-core Docker limit.
MobileNetV2 also required the fewest parameters and had the lowest measured CPU latency: 2.59 million parameters and 60.59 ms median, compared with 4.38 million and 83.35 ms for EfficientNetB0, and 24.11 million and 171.27 ms for ResNet50. Latency was measured with TensorFlow 2.18 inside a three-core Docker limit on an Intel Xeon E5-2699 v3. Processor choice changes throughput, not the mathematical definition of accuracy.
Five-fold grouped cross-validation
A second test used all 1,232 images tied to 190 physical leaves. The folds were stratified by class; every leaf appeared in one test fold and never in that fold’s training or validation data. MobileNetV2 and the MLP were refitted in every fold. Aggregate accuracy was 99.84%, balanced accuracy 99.87% and macro F1 99.83%; two of 776 leaf-scorch images were assigned healthy and all 456 healthy images were assigned correctly. Mean PlantDoc healthy recall across the five fitted models was 80.00% with a standard deviation of 8.38 percentage points.
Five-fold physical-leaf cross-validation
Every one of 190 physical leaves appears in one test fold and never in that fold’s training or validation data.
Values
| Series | Value | Note |
|---|---|---|
| Fold 1 | Controlled accuracy 100.00% · PlantDoc healthy recall 87.50% | 248 test images from 38 physical leaves; confusion matrix [[92, 0], [0, 156]]. |
| Fold 2 | Controlled accuracy 99.61% · PlantDoc healthy recall 73.96% | 255 test images from 38 physical leaves; confusion matrix [[92, 0], [1, 162]]. |
| Fold 3 | Controlled accuracy 99.59% · PlantDoc healthy recall 68.75% | 242 test images from 38 physical leaves; confusion matrix [[90, 0], [1, 151]]. |
| Fold 4 | Controlled accuracy 100.00% · PlantDoc healthy recall 82.29% | 247 test images from 38 physical leaves; confusion matrix [[90, 0], [0, 157]]. |
| Fold 5 | Controlled accuracy 100.00% · PlantDoc healthy recall 87.50% | 240 test images from 38 physical leaves; confusion matrix [[92, 0], [0, 148]]. |
MobileNetV2 with a refitted 256-unit ReLU6 MLP in each fold; 1,232 grouped PlantVillage Strawberry images and a separate 96-image PlantDoc transfer check.
The image classifier assigns one of its declared visual labels to the current frame. Biomass forecasting, nutrient-state estimation and stress attribution use separate models with repeated images and measured cultivation variables.
Image capture, model and review
Each result remains attached to the image, plant, cultivation cycle, camera settings and model version.
Values
| Series | Value | Note |
|---|---|---|
| Indexed RGB capture | Image and acquisition record | The image is stored with plant, cycle, position, recipe, camera, exposure and illumination identifiers. |
| Image check | Focus, exposure, occlusion and pose | Images outside declared quality limits are rejected before segmentation or classification. |
| Feature encoder | MobileNetV2 · 224 × 224 px | The convolutional encoder provides an efficient feature representation. ImageNet pretraining supplies generic visual features, not plant-health labels. |
| MLP classifier | 1,280 → 256 → C | Global-average-pooled features pass through a 256-unit ReLU6 layer, dropout 0.25 and a final C-class linear layer. |
| Confidence | Temperature-scaled probabilities | One scalar temperature is fitted on the validation set so reported confidence better matches observed correctness. |
| Plant history | Repeated observations of one plant | A persistent change across indexed captures carries more evidential weight than an isolated frame. |
Note. The encoder follows MobileNetV2 (Sandler et al., 2018), initialised with ImageNet weights (Deng et al., 2009); confidence calibration follows Guo et al. (2017).
Model fitting
- Fit the MLP.The ImageNet encoder remains frozen while the classifier learns from the grouped training images.
- Fine-tune the final encoder blocks.A lower learning rate adjusts the highest-level visual features; validation macro F1 controls early stopping.
- Calibrate probability.One temperature value is fitted to validation logits after the model weights stop changing.
- Lock the test.Architecture, preprocessing, class thresholds and the low-confidence rule are fixed before test images are opened.
- Report each image domain separately.PlantVillage, PlantDoc and FlavoRotor results use separate tables, because their camera conditions differ.
Training and validation accuracy by epoch
The encoder was frozen for three epochs, then its final blocks were fine-tuned for two epochs. Select an epoch to inspect the recorded accuracy and loss.
Accuracy · vertical scale 0.9500–1.0000
Values
| Series | Value | Note |
|---|---|---|
| Epoch 1 · classifier head | Training accuracy 0.9918 · validation accuracy 1.0000 | Training loss 0.021185 · validation loss 0.000098. |
| Epoch 2 · classifier head | Training accuracy 1.0000 · validation accuracy 1.0000 | Training loss 0.000333 · validation loss 0.000033. |
| Epoch 3 · classifier head | Training accuracy 1.0000 · validation accuracy 1.0000 | Training loss 0.000354 · validation loss 0.000014. |
| Epoch 4 · fine-tuning | Training accuracy 0.9765 · validation accuracy 1.0000 | Training loss 0.072895 · validation loss 0.000014. |
| Epoch 5 · fine-tuning | Training accuracy 0.9847 · validation accuracy 1.0000 | Training loss 0.055849 · validation loss 0.000015. |
Note. TensorFlow 2.18.0 run completed 29 July 2026 with seed 20260729. Values are read directly from training-history.csv; the vertical axis is limited to 0.95–1.00 so small changes remain visible.
Controlled-image benchmark
The reproducible TensorFlow 2.18.0 run completed on 29 July 2026. After five epochs, the locked model classified all 199 images in the grouped PlantVillage test partition correctly: 72 healthy and 127 leaf scorch. The test partition contains 30 physical leaf groups that were absent from training and validation. Accuracy, macro F1 and balanced accuracy are each 1.0000 for this controlled two-class benchmark. The fitted temperature is 0.500584 and the ten-bin expected calibration error is 0.0000361.
Controlled Strawberry test-set classifications
Rows are published PlantVillage labels and columns are model predictions. Select a cell to inspect the exact count.
Predicted class
199 images · 30 physical leaf groups · 199 correct classifications
Values
| Series | Value | Note |
|---|---|---|
| Actual healthy · predicted healthy | 72 images | All 72 healthy test images were assigned to the healthy class. |
| Actual healthy · predicted leaf scorch | 0 images | No healthy test image was assigned to leaf scorch. |
| Actual leaf scorch · predicted healthy | 0 images | No leaf-scorch test image was assigned to healthy. |
| Actual leaf scorch · predicted leaf scorch | 127 images | All 127 leaf-scorch test images were assigned to leaf scorch. |
Note. The leaf-grouped test partition contains 199 previously withheld images from 30 physical leaves. The complete TensorFlow run and model hash are recorded in training-summary.json.
PlantVillage photographs isolated leaves against a controlled background. The result above therefore measures discrimination between those two published Strawberry classes under the same acquisition style; it is not substituted for a measurement from the FlavoRotor camera.
Uncertainty around the measured scores
Every classification score is estimated from a finite test set. The controlled test observed 199 correct assignments from 199 images, but its exact two-sided 95% interval is 98.16–100%. Class recall has wider intervals because each class contains fewer observations: 95.01–100% for 72 healthy images and 97.14–100% for 127 leaf-scorch images. The interval states how much precision the test count provides; it does not change the observed confusion matrix.
Performance estimates with exact 95% confidence intervals
A perfect observed score from a finite controlled test still has uncertainty. The natural-background check is lower and wider.
Values
| Series | Value | Note |
|---|---|---|
| Controlled test accuracy | 100.00% · 95% CI 98.16–100.00% | 199 correct outcomes from 199 published test observations. The interval is the two-sided 95% Clopper–Pearson exact binomial interval. |
| Controlled healthy recall | 100.00% · 95% CI 95.01–100.00% | 72 correct outcomes from 72 published test observations. The interval is the two-sided 95% Clopper–Pearson exact binomial interval. |
| Controlled leaf-scorch recall | 100.00% · 95% CI 97.14–100.00% | 127 correct outcomes from 127 published test observations. The interval is the two-sided 95% Clopper–Pearson exact binomial interval. |
| PlantDoc healthy-class recall | 82.29% · 95% CI 73.17–89.33% | 79 of 96 healthy-labelled natural-background images were assigned healthy. Brier score 0.1662; mean confidence among the 17 wrong assignments 94.26%. |
Note. Two-sided Clopper–Pearson intervals calculated from the locked test counts. PlantVillage and PlantDoc are reported separately because their image domains differ.
Natural-background check
The frozen model was then applied without retraining to all 96 images in PlantDoc's Strawberry leaf class. These photographs contain natural backgrounds, changing scale, partial leaves and varied lighting. The model assigned 79 images to healthy and 17 to leaf scorch, which gives healthy-class recall of 79 / 96 = 0.8229. PlantDoc does not publish a matching Strawberry leaf-scorch class, so this check reports recall for its healthy class rather than two-class accuracy.
Natural-background Strawberry images from PlantDoc
The same frozen model was applied to PlantDoc images labelled Strawberry leaf. Three low-confidence-order and three high-confidence-order examples are shown.
Values
| Series | Value | Note |
|---|---|---|
| PlantDoc image 1 | Upstream label: healthy · predicted leaf scorch | Fragaria-virginiana-6.jpg · P(healthy) 0.000000025 · SHA-256 49738f34…93b1. |
| PlantDoc image 2 | Upstream label: healthy · predicted leaf scorch | 102_0829.JPG.jpg · P(healthy) 0.000008215 · SHA-256 1e5a93bc…6097. |
| PlantDoc image 3 | Upstream label: healthy · predicted leaf scorch | img_0164.jpg · P(healthy) 0.000009111 · SHA-256 47344a43…69a3. |
| PlantDoc image 4 | Upstream label: healthy · predicted healthy | indian-strawberry-leaf.jpg · P(healthy) > 0.999999999999 · SHA-256 0d2b7902…d94e. |
| PlantDoc image 5 | Upstream label: healthy · predicted healthy | Strawberry+leaves.jpg · P(healthy) > 0.999999999999 · SHA-256 368f4a9c…af54. |
| PlantDoc image 6 | Upstream label: healthy · predicted healthy | strawberry-plant-leaves-strawberry-red-spots-on-strawberry-plant-leaves.jpg · P(healthy) 1.000000 · SHA-256 5cb64d2e…728c. |
Note. Images from the PlantDoc Strawberry leaf class (Singh et al., 2020), repository commit 5467f60, CC BY 4.0. Labels shown here are the upstream dataset labels; probabilities are produced by the recorded FlavoRotor reference run.
Metric definitions
Precision answers: of the images assigned to one class, how many are correct? Recall answers: of the images that truly belong to that class, how many were found? F1 combines both values. Macro F1 gives every class the same weight, so the larger leaf-scorch class cannot hide weak performance on healthy leaves. The report also contains the complete confusion matrix, balanced accuracy, image count and physical-leaf count for every class.
ExplanationF1 combines precision and recall. Macro F1 is the arithmetic mean of the class-level F1 values, so a large class cannot hide poor performance on a smaller class.
ExplanationPredictions are grouped into confidence bins. ECE is the weighted difference between observed accuracy and mean reported confidence in those bins.
Following one plant through time
Repeated images of the same plant form a time series. Projected canopy area, calibrated colour, developmental stage and image quality are stored beside temperature, light, pH, EC and recipe version at the same timestamp. Growth rate compares the same plant at two recorded times. It does not compare unrelated plants photographed on different days.
| Output | Reference annotation | Use |
|---|---|---|
| Canopy area and growth rate | manual masks and a physical scale reference | tracks the plant's visible growth |
| Developmental stage | crop-specific, expert-reviewed labels | aligns treatment timing with plant development |
| Colour index | colour target and matching laboratory measurements | measures visible colour change |
| Plant-health class | expert label and supporting laboratory result where required | records class and probability for review |
| Image quality | focus, exposure, occlusion and pose labels | identifies unsuitable images |
Datasets used to test longitudinal methods
| Dataset | Repeated observations | Role in the research programme |
|---|---|---|
| Aalto lettuce | 18 identified heads, 30 biomass days, 731 canopy images and 1,443 environmental records | implemented three-day biomass forecast with plant-wise validation |
| HydroGrowNet | three 30-day Batavia cycles and more than 390,000 segmented images aligned with pH, EC and water temperature | independent multimodal growth and anomaly dataset |
| Multi-sensor lettuce phenotyping | 45 plants over 42 days, two cultivars, three nitrogen levels and two irrigation rates | external RGB, 3D, multispectral, SPAD, fluorescence and morphology dataset |
A separate model for each measured endpoint
| Question | Model | Reason | Reference value |
|---|---|---|---|
| Does the current leaf image match a declared visual class? | MobileNetV2 + 256-unit MLP | compact image encoder; class probabilities can be calibrated and reviewed | expert or published class label |
| What fresh biomass is expected three days from now? | ridge autoregression | uses repeated mass and recent growth increments while regularising a small dataset | measured fresh biomass |
| How did cultivar and nutrient solution change tissue chemistry? | factorial ANOVA | tests cultivar, treatment and their interaction directly | laboratory nitrogen, sulphate, organic acid and chlorophyll measurements |
| Is the plant departing from its expected trajectory? | forecast residual plus consecutive-capture rule | requires persistence through time and retains the sensor and image context | next measured observation |
Stored model output
Every model output stores the image hash, plant ID, model version, preprocessing version, probability for every class, calibrated confidence and image-quality score. A low-quality or low-confidence image is marked for review together with the reason. The original image and complete class-probability vector remain available beside the final label.